How do I find what is slowing down my AI workflow?
Use AI to maintain an evidence-backed investigation of CPU, memory, storage, models, agent concurrency, and cloud limits—and verify the result.

Conceptual illustration: follow the workflow to find the constraint.
Your AI workflow feels slow, so you open Task Manager or Activity Monitor. One machine shows 100 percent CPU. Another has used 11.15 GB of swap. Which machine needs more hardware?
You cannot answer that from either number.
A busy resource is a lead, not a diagnosis. The number matters only when it lines up with the step where useful work is waiting. That may be a local process. It may be a model loading into memory, a request waiting behind another request, a cloud quota, a slow disk, a retry loop, or a person correcting an answer that arrived quickly but was wrong.
In this guide, we will start at the beginning. We will define the work, capture a baseline, follow the wait across the complete workflow, change one thing, and run the same test again. When we finish, you will have evidence for one decision instead of a dashboard full of guesses.
Who is this guide for?
This guide is for IT professionals, developers, and AI workflow builders who need to diagnose slow or resource-heavy work on Windows and macOS. It covers workflows that combine cloud models, local agents, local models, tools, and services. You should be comfortable opening a system monitor; the prompts and worksheet help an approved AI assistant organize the investigation.
IT and AI leaders can use the same evidence to set performance and quality targets, decide where work should run, and evaluate tuning or hardware proposals. Start with one repeatable workflow and define what an acceptable result looks like before changing the environment.
The business reason for doing this well is covered in Running AI Well Means Managing Everything Around It. Here, we are going to prove where the time and resources went.
This is Part 2 of the Running AI Well series:
- Running AI Well Means Managing Everything Around It — published business case.
- How do I find what is slowing down my AI workflow? — you are here.
Why can a busy dashboard point to the wrong bottleneck?
Look at this Windows capture first.
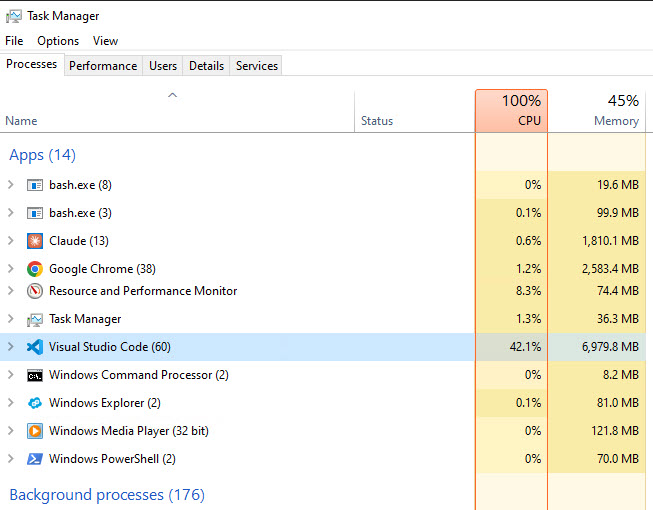
The machine reports 100 percent CPU and 45 percent memory use. Visual Studio Code has 60 processes, accounts for 42.1 percent CPU in this sample, and uses almost 7 GB of memory. Claude, Chrome, shells, monitoring tools, and 176 background processes are also active.
That is enough evidence to investigate CPU saturation during this interval. It does not prove Visual Studio Code caused the delayed AI task. The process group may include agents, terminals, extensions, searches, language servers, builds, and other work. We do not have task progress or request timing in the screenshot.
Now look at the Mac.
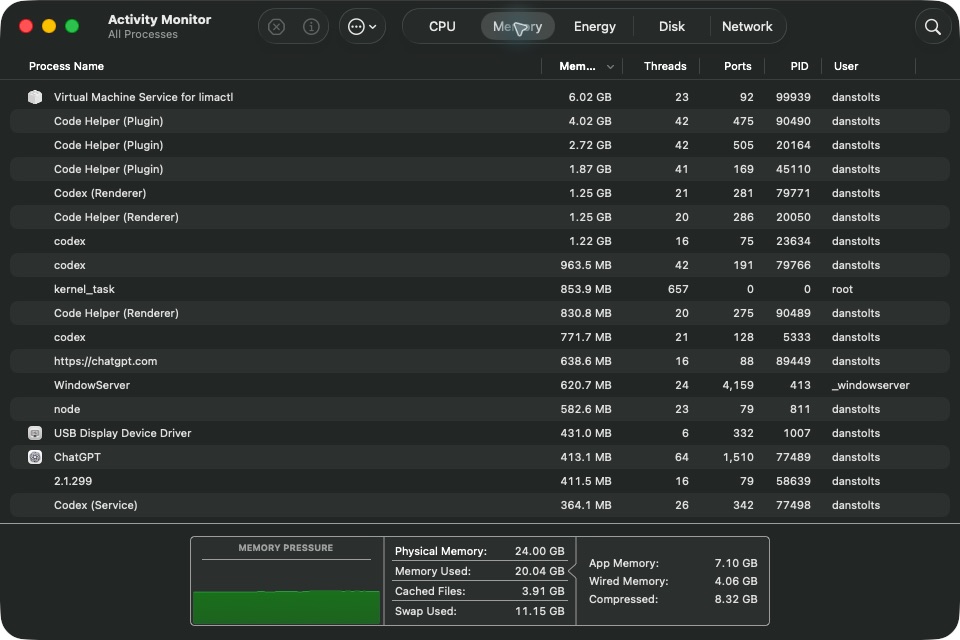
This Mac has 24 GB of physical memory. Activity Monitor reports 20.04 GB used, 8.32 GB compressed, and 11.15 GB of swap used. The memory-pressure graph is green.
It would be easy to declare the Mac memory-starved because 11.15 GB of swap sounds alarming. Apple says memory pressure combines free memory, swap rate, wired memory, and cached files to show how efficiently memory is serving current demand. Green pressure means the system considers the current memory service efficient. Swap used tells us disk space has been assigned to swapped data. It does not tell us how much swapping is happening during the task we care about. See Apple's explanations of memory use and memory pressure.
The CPU view adds another useful contradiction.
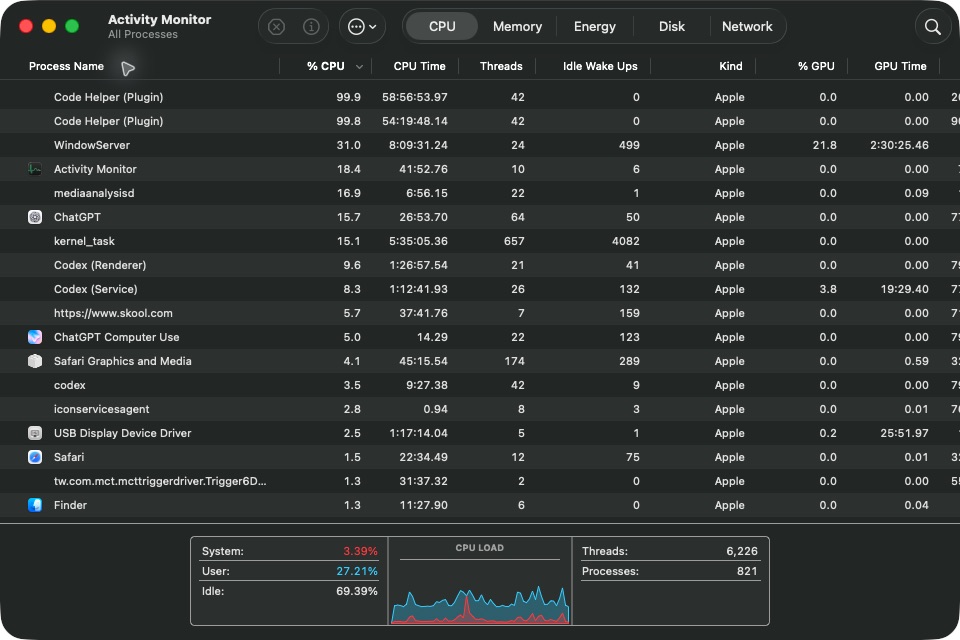
Two Code Helper processes are near 100 percent CPU, but the Mac still reports 69.39 percent idle across the machine. A process can fill one execution lane while aggregate CPU is not saturated. Apple's Activity Monitor CPU guide defines the System, User, and Idle totals shown at the bottom of this view.
The same Mac supplied a second lesson while this article was being revised. A live Activity Monitor capture showed 73.54 percent User, 26.46 percent System, and 0.00 percent Idle: aggregate CPU really was saturated at that instant. The two Code Helper processes were near 100 percent, but visible Python, WindowServer, Codex, kernel, file-system, and security work also contributed. A few moments later, the live view reported 75.20 percent Idle. The capture was not tied to a timed workflow step and included activity from collecting evidence for this article, so it does not identify a culprit. It shows how quickly a screenshot can move from full saturation to substantial headroom. The observation and its limits are preserved in MAC-LIVE-CPU-OBSERVATION-2026-10-18.json.
These captures were taken on different machines, at different times, with different workloads. The Windows screenshots do not preserve a visible workload timestamp, and the Mac CPU and Memory tabs were sampled separately. They are observations, not a Windows-versus-Mac benchmark. Their value is that both punish the same shortcut: selecting the largest or scariest number and calling it the bottleneck.
I learned the same lesson before these screenshots. I was doing development on a Lenovo ThinkPad X1 Extreme Gen 2, machine type 20QV, manufactured in May 2020. It had six physical cores, 12 logical processors, 64 GB of memory, and an M.2 drive. I experienced a substantial improvement in the same development work after moving it to a VM on an HP Gen10 server with NVMe storage, even though the VM had only eight logical processors.
This was not a comparison between 12 equivalent logical processors and eight equivalent logical processors. The laptop CPU and the Gen10 server CPU came from different processor classes and generations, with different per-core performance, cache, memory bandwidth, power limits, cooling, and ability to sustain work. The server platform also changed storage and workload isolation. We did not preserve the measurements needed to divide the improvement among those factors. The experience shows why logical-processor count alone did not predict the outcome. The next time we make this comparison, the worksheet in this guide will help isolate contributors if we control or record the variables that changed.
🎓 Lesson
- Utilization tells you where to investigate. Timing and task progress tell you whether that resource delayed the accepted result.
What is the value of finding the actual wait?
The measurement changes the decision. It can keep you from buying memory for a CPU-bound phase, moving a local workload to the cloud when storage is the delay, or routing a simple research task to an expensive model because the smaller model was never tested. It also gives security and operations teams evidence for a narrow tuning change instead of a permanent exception based on intuition.
I want the result to be useful at three levels: fix today's workflow, record the boundary where the fix applies, and give the router enough evidence to make the next placement or model decision without repeating the entire investigation.
What should IT and AI leaders require?
Leadership enters before anyone opens a monitor. A leader defines the outcome worth improving and the evidence required to justify a change. "Reduce CPU" is not an outcome. "Reduce the median time to an accepted research summary against an agreed baseline and target without lowering the pass rate, weakening controls, or increasing correction time" is an outcome that a team can measure and defend.
IT leadership owns the conditions that make the evidence possible: supported telemetry, synchronized clocks, configuration records, capacity boundaries, retention, and a safe test environment. AI leadership owns the quality contract for model, reasoning effort, context, tools, routing, and agent concurrency. Security and data owners decide which evidence an assistant may access and which controls must remain intact. The workflow owner defines acceptance and the cost of delay or correction. Procurement and finance should compare cost per accepted result and the capacity the organization can actually use, rather than buying from utilization screenshots or vendor peak numbers.
| Leadership role | Decision it owns | Evidence gate |
|---|---|---|
| Workflow or business owner | Required result, pass criteria, latency/throughput target, correction tolerance | Same accepted-result test before and after |
| IT/platform leader | Observability, host/service capacity, placement, reliability, supportability | Time-aligned host/service evidence and complete configuration fingerprint |
| AI/automation leader | Model, reasoning effort, context, tools, routing, agents and fallback | Repeated run-level pass rate, accepted-result time, tokens/cost and correction |
| Security/data owner | Approved AI access, evidence handling, controls and exceptions | Data classification, approved service/account, retained protections and audit trail |
| Finance/procurement | Cloud commitment, hardware or service investment | Total cost and capacity per accepted result, including operations and displaced work |
Use a simple leadership gate before adopting the change:
- What accepted outcome are we improving, and who owns it?
- Which step waited, and what time-aligned evidence connects the proposed resource to that wait?
- Which single variable changed, and which baseline revision and run IDs support the comparison?
- Did quality, security, resilience, correction time, or another team's resource absorb the apparent gain?
- Where does the finding apply, what remains unknown, and what change triggers a retest?
- Who owns implementation, measurement after rollout, and rollback?
The leader's job is not to choose the scariest counter. It is to make evidence the admission requirement for tuning, routing, and purchasing decisions—and to fund the measurement capability instead of asking teams to prove performance from screenshots alone.
How do you find and verify the real constraint?
Prerequisites and assumptions — allow 30–60 minutes for a first baseline. Use a recurring, bounded workload on a machine where a slowdown or stopped process cannot affect customers. On Windows, Task Manager and Resource Monitor are built in; Performance Monitor collection and Defender recording require an elevated shell, a supported Windows edition, and writable disk space for the
.blgand.etltraces. Defender Performance Analyzer requires Windows 10 or later and Defender platform 4.18.2108.X or later. On macOS, use Activity Monitor with permission to inspect the processes you own; system diagnostics may require administrator authentication and can contain sensitive system details. The Ollama example is optional and requires a running local Ollama server plus enough RAM or VRAM for an already-installed model. Before changing security policy, confirm who owns that policy and how to roll it back.
Need implementation help? Just In Time AI can help you instrument the complete workflow, identify the binding constraint, and implement a measured fix without weakening required controls. Request AI Systems Setup and Coaching.
Step 0: Define the result before you open a monitor
If you do not define the work first, every changing graph can look important.
Choose one recurring workflow. Keep it narrow enough to repeat. A useful example is an AI-assisted research job with five visible steps:
- Find candidate sources.
- Download or open the selected documents.
- Extract the relevant text.
- Ask a local or hosted model to produce a structured summary.
- Check the summary against the source and accept or reject it.
Now define what counts as success. For this example, the result is not "the model returned text." The result is a summary that contains the required fields, cites the correct source sections, and needs no factual correction.
Record these items before the run:
| Field | What to record |
|---|---|
| Workload | Exact input files, prompt or task, and expected output |
| Host environment | CPU and accelerator model, assigned logical processors, RAM/VRAM or unified memory, storage, operating system/build, power mode, and thermal constraints |
| Software environment | Application, orchestrator, runner, extensions, MCP servers, language servers, containers/VMs, and their versions or configuration revision |
| Model path | Hosted provider and exact model/version where exposed, or local runtime, model, quantization, device placement, and cold/warm state |
| Inference controls | Reasoning effort or thinking budget, context limit, maximum output, sampling controls, tool-use mode, and other settings the product exposes |
| Instructions and retrieval | System/developer instructions or configuration revision, prompt/template revision, retrieved sources/index revision, and cache state |
| Agent topology | Configured simultaneous-agent/worker limit, actual peak active, queued and idle-resident workers, model assigned to each task class, and admission/backpressure policy |
| Competing work | Builds, containers, virtual machines, local models, security/scanning, synchronization, backup, indexing, and foreground user work |
| Timing | Start, each major step, first useful output, finish |
| Acceptance | Pass/fail criteria and correction time |
| Usage | Tokens, cached tokens, requests, retries, queue time, and cost where exposed |
Save the inputs. You will run the same work again after the change.
You do not have to maintain this record by hand. Give the AI workflow constraint worksheet to an approved AI assistant and make it the investigation recorder. The assistant should populate only evidenced fields, attach an evidence ID to each value, mark an applicable missing field Unknown, mark an irrelevant field Not applicable with a supported reason, ask for the next smallest read-only observation, and update the same working copy after each run. It must preserve a row for every run and derive medians, ranges, and pass rates from those rows. You remain the decision owner: the assistant prepares the baseline-lock candidate and proposed experiment, but it does not silently freeze the baseline or change the system.
Capture configuration as part of the evidence
The application name is not a configuration. Two runs both labeled "Codex," "Claude," "ChatGPT," or "Ollama" can use a different model, reasoning effort, context, tool set, system instructions, agent limit, runtime placement, or cache state. Those changes can alter latency, token use, answer quality, local process count, memory residency, tool activity, and correction time without changing the visible task.
Model and reasoning settings need their own lines in the record. A higher reasoning effort may improve a difficult result and reduce correction, while adding provider processing time, generated reasoning work, or cost. A smaller model or lower effort can be the efficient route for a bounded task only after it passes the same acceptance test. For a hosted model, much of the inference cost is remote even though local tools, browsers, indexes, and builds still consume the workstation. For a local model, model size, quantization, context, parallelism, batch settings, and CPU/GPU placement directly change local memory and compute demand.
Agent concurrency needs three numbers: configured maximum, actual peak active, and peak queued. Also record workers that are idle but still resident. A configured limit of 60 does not prove 60 agents ran simultaneously, while a screenshot containing 60 editor processes does not prove there were 60 agents. Conversely, ten agents can create far more than ten processes because each may use terminals, browsers, language servers, tools, and child processes. Map agent IDs or job IDs to their model, tools, child processes, start/finish times, and accepted result where the platform permits it.
Finally, preserve the system configuration that can silently move the result: orchestration policy, per-model routing, timeouts, retry/backoff rules, polling interval, tool permissions, working-directory and index scope, environment limits, VM/container CPU and memory caps, power mode, security policy, synchronization, backup, and indexing. Store a redacted configuration export or revision identifier when possible. Never publish secrets, tokens, private paths, or hidden instructions; record their version or hash instead.
Use AI to help with discovery
An AI assistant can turn scattered screenshots, configuration exports, logs, and timing notes into a disciplined investigation. The best use is not a one-time question. Make it maintain the worksheet throughout the investigation: interview for missing facts, register each item in the evidence ledger, populate supported fields, expose contradictions, propose the next observation, freeze the approved baseline, and compare the changed run. It should organize the evidence and expose missing measurements, not declare a cause from the largest number on the screen.
Use only an organization-approved service and account, and follow the applicable data-classification, customer-contract, retention, residency, and access rules. Minimize and redact secrets, credentials, customer data, source content, prompts, hostnames, user IDs, URLs, environment values, request metadata, private paths, and unrelated identifiers. If the evidence cannot be shared safely under those rules, use an approved local/offline assistant or keep it out of the assistant.
Choose the AI operating mode that matches the access you can approve:
| AI operating mode | What the AI can do | What you provide or approve |
|---|---|---|
| Hosted or desktop chat without machine access | Maintain the Markdown worksheet, interview you, interpret minimized screenshots/logs, expose gaps, and design the next collection step | Approved account, sanitized evidence, timestamps, and saved worksheet copy |
| Local coding/operations agent with approved machine access | Create the working copy and evidence folder, run bounded read-only inventory commands, preserve raw output, update the ledger, and correlate local configuration with the workflow | Exact machine/workspace scope; separate approval for elevation, long-running monitoring, or any state change |
| Assistant connected to approved monitoring | Query the defined host, counters, and interval; preserve query/aggregation details; compare normal and slow windows; update the worksheet | Approved connector, narrow time/host scope, workflow markers, and permission to access that telemetry |
| Approved local/offline model | Keep sensitive evidence within the approved boundary while performing the same recorder and comparison work | A model that passes the task, enough local capacity, and the same evidence/provenance rules |
The visible chat window does not tell you which access mode is active. State what the assistant may read, which machine or monitoring source it may query, where it may write the working copy, and which actions require separate approval.
Start by attaching or pasting the worksheet and use this coaching prompt:
Act as my AI workflow performance coach and worksheet recorder. Maintain the attached worksheet as the source of truth. Fill only what evidence supports. Prefix every populated value with Observed, Owner-reported, or Inferred and cite its evidence ID. Use Unknown when a field applies but evidence is missing; use Not applicable only with a reason and evidence ID. Ask no more than three highest-value questions or read-only evidence requests at a time. Predeclare the acceptance test, instrumentation, and baseline repetition count; record every baseline run; derive the summary from those run IDs; then wait for my approval before creating an immutable baseline revision. Never edit a locked baseline in place; a correction creates a new revision and invalidates affected comparisons. Only then change one variable, register every after-change run against that revision, and judge accepted-result time and quality rather than response speed alone. If you can edit files, resume the working copy, finalize each locked snapshot before hashing it, store the digest in the mutable registry or a sidecar, and leave the blank template unchanged; otherwise return the complete updated Markdown worksheet and identify the message containing each locked revision.
If the AI still needs to build the initial record, continue with this baseline prompt:
Act as a performance investigator. Separate observed facts, interpretations, and unknowns. High utilization is a lead, not proof of the bottleneck. I need to diagnose this recurring AI workflow: [describe task]. The accepted result is [pass/fail criteria]. It runs through [models, agents, tools, services, and machines]. Build a step-by-step measurement plan. Include timestamps, model/version, reasoning effort, context and cache state, configured agent maximum, actual active/queued/idle workers, routing, runtime settings, host and VM/container limits, competing work, tokens, retries, and correction time. Recommend read-only collection first. Do not diagnose the bottleneck until the delayed step is correlated with evidence.
Use this prompt when you have screenshots or logs:
Analyze this evidence from [named workflow step and time interval]. Return a table with observed fact, possible interpretation, alternative explanation, confidence, and next evidence needed. Rank no more than three hypotheses. Do not treat process count as agent count, configured capacity as observed concurrency, or aggregate CPU, swap allocated, memory used, or a large process as proof that it delayed the task. Label missing telemetry as unknown.
Use this prompt when model choice or reasoning effort may be the variable:
Design a controlled comparison for [task class]. Test one variable: either compare [models] at one fixed supported reasoning-effort setting, or compare [effort settings] on one fixed model/version. Hold input, prompt/template, instructions, tools, retrieval/index revision, cache policy, and acceptance test constant. Capture queue time, first useful output, accepted-result time, pass/fail, correction time, tokens, retries, provider cost where exposed, and local resource/tool activity. Recommend the lower-cost route only if it repeatedly passes. Identify warm-cache, provider-load, and changed-context confounders. If I request a model-by-effort matrix, use a fully crossed design and do not attribute an effect to one factor without the matching comparisons.
Use this prompt to select the next test:
Based on the evidence below, recommend one reversible experiment. Return: delayed step, hypothesis, supporting evidence, contradictory or missing evidence, one variable to change, variables to hold constant, expected result, acceptance test, rollback trigger, and the result that would falsify the hypothesis. Do not recommend disabling security, a broad exclusion, or a hardware purchase as the first experiment.
The downloadable AI workflow performance discovery prompt pack also includes evidence-intake, baseline-lock, agent-concurrency, Performance Monitor, model/effort, after-change, and decision-record prompts.
For a local agent, the prompt pack also supplies a bounded collection prompt that creates the worksheet working copy and evidence folder, runs built-in read-only inventory, preserves raw outputs, and stops before elevation, monitoring, or system changes. For an assistant connected to approved monitoring, it includes a query prompt that preserves the exact interval, filters, sampling, aggregation, and missing-data boundaries.
Once the experiment is complete, use the leadership-brief prompt in the pack to translate the technical record into an outcome, evidence, risk, cost, ownership, and retest decision without stripping away the limits of the data.
WARNING: Do not create a resource-exhaustion test on a production machine just to make the screenshots dramatic. Capture a real recurring workflow, or use a bounded test system where a stalled process cannot interrupt customer work.
Step 1: Mark the wait, not just the start and finish
One total duration hides several different waits.
For every major step, record:
- Time submitted
- Time execution started, if the tool exposes it
- Time first useful output appeared
- Time execution finished
- Time the result passed review
The gap between submission and execution is queue time. The gap between execution and first output can include setup, model loading, retrieval, network travel, and provider processing. The gap between first output and finish is sustained work. The gap between finish and acceptance is correction and review.
That last gap belongs in the measurement. A smaller or cheaper model that returns in ten seconds and takes fifteen minutes to correct did not beat a slower model that passed on the first attempt.
Use one clock for all of this. If the application log uses UTC, record your worksheet in UTC. If you use local time, include the offset. A screenshot without a workload timestamp is difficult to correlate later.
🎉 Tip: You do not need perfect tracing to improve the first workflow. A timestamp at each handoff is enough to expose many long waits. You can capture that in the next run.
Step 2: Triage the Windows host
Start with Task Manager because it answers the first question quickly: what is busy now?
- Press Ctrl+Shift+Esc.
- Select Processes.
- Select the CPU, Memory, Disk, or Network column to sort it.
- Expand the application group. A group total can hide many editors, terminals, renderers, language servers, and agent processes.
- Keep your workflow timestamps beside the live view.
Microsoft describes Task Manager as the built-in Windows view for application and process performance and resource use. The Task Manager troubleshooting guide explains what each tab can show.
Task Manager is a triage view. If the issue is intermittent, a live screenshot will probably miss it. Use Resource Monitor next:
- Press Win+R.
- Enter
resmonand press Enter. - Start on Overview, then select the resource that was busy.
- Select the suspected process so the lower panes filter to its activity.
- Watch the sixty-second graph while the named workflow step runs.
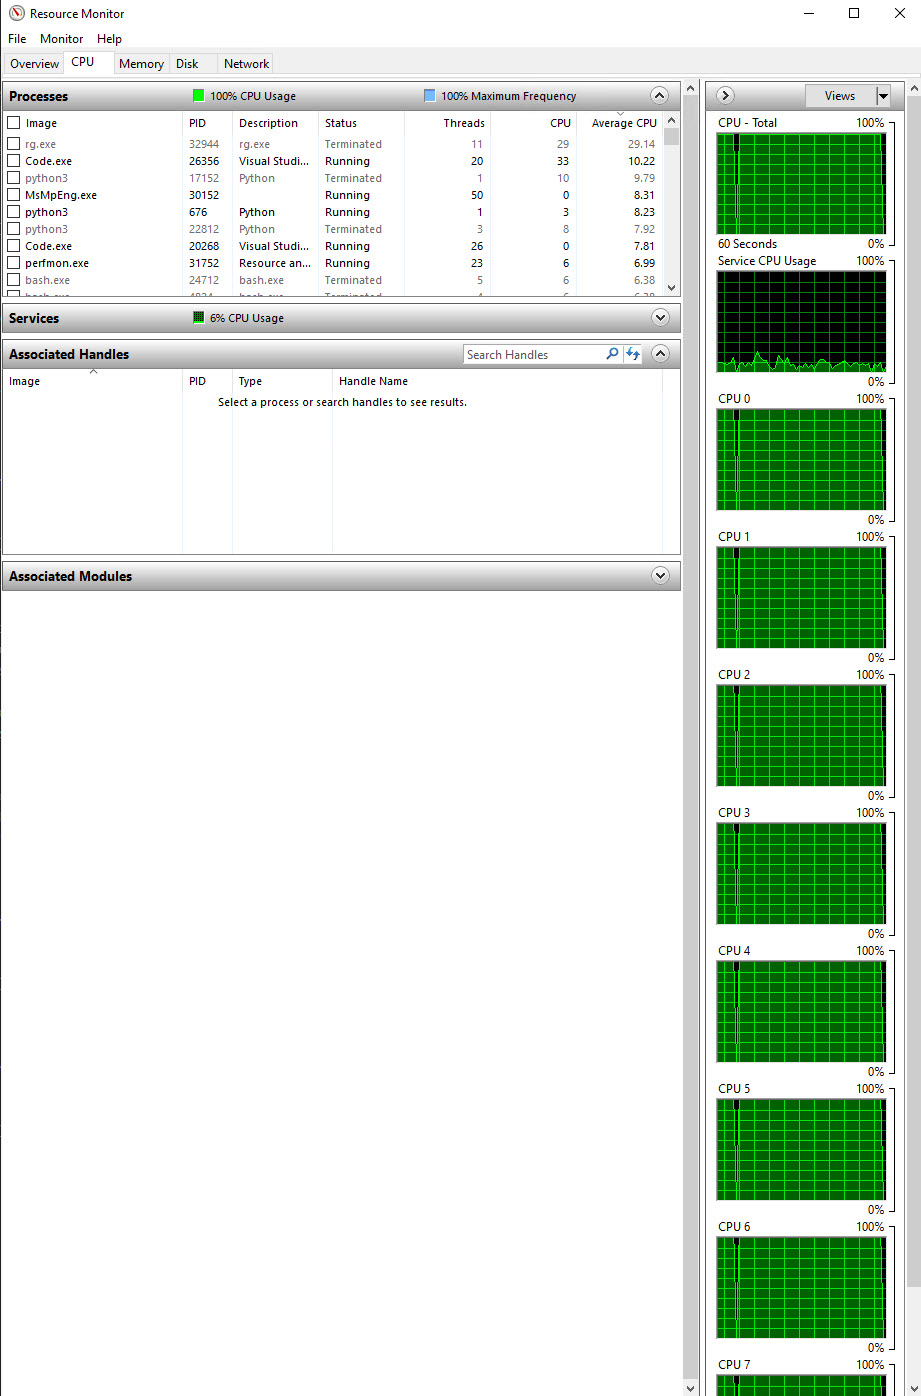
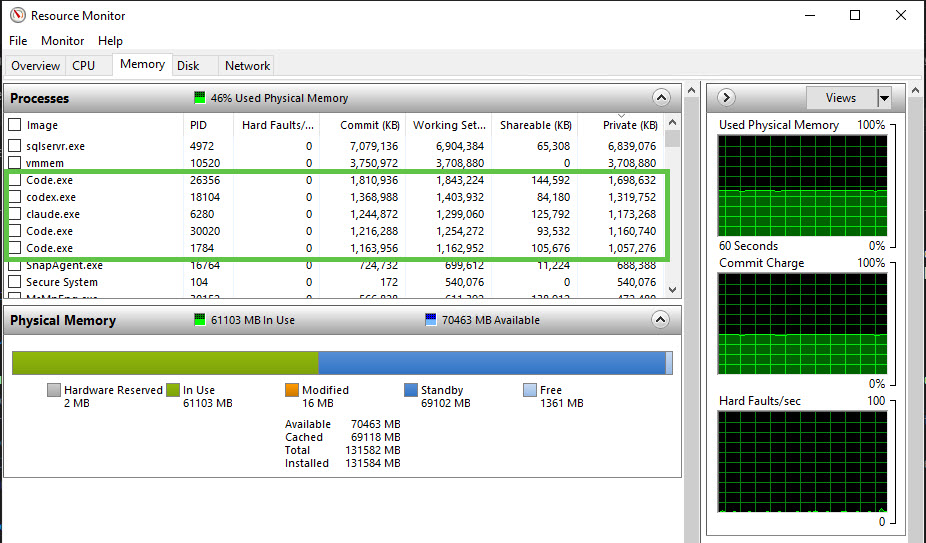
The supplied Resource Monitor capture shows 100 percent CPU and 100 percent maximum frequency while memory remains at 46 percent used in the separate Memory view. Visible rows include search, Python, security, monitoring, and multiple Code processes; some rows are marked Terminated, so the screenshot does not establish that every visible row was active. It is a strong CPU-saturation observation for that interval. It is still not proof that the model call was waiting on CPU.
Use Performance Monitor to record the interval, not photograph an instant
Task Manager and Resource Monitor answer what is happening now. Performance Monitor logging answers what changed before, during, and after the slowdown. That distinction matters when the problem appears only under sustained agent load, a scheduled scan, model loading, memory pressure, backup, indexing, a build, or a periodic poll. A screenshot can miss the event or capture its aftermath. A time-series log can show whether CPU saturation, storage latency, paging, process growth, or network activity rose at the same time as the delayed workflow step.
Record a normal comparison window as well as the slow window when possible. Mark workflow submission, execution start, first useful output, finish, and acceptance using the same clock as the collector. Preserve the configured agent maximum and observed active/queued counts beside the log. The correlation becomes much stronger when the .blg contains activity before the task, throughout the wait, and after it clears.
Keep collection bounded. A one-second interval is useful for a short reproducible run; a longer observation window may need a wider interval and a circular size limit to control overhead and disk use. Choose counters that answer the current question rather than retaining every per-process counter indefinitely. Record the counter list, interval, start/stop time, output size, host configuration, and any gap or restart. Performance logs can expose process, adapter, machine, and workload identifiers, so protect and redact them under the same evidence-handling rules as screenshots and configuration exports.
Performance Monitor can significantly reduce performance. The collector consumes CPU, memory, and storage I/O; wildcard process counters grow with the number of processes; a one-second interval multiplies that work; and writing the log to the disk under investigation adds more I/O. On an already saturated machine, the observer can lengthen the workflow, change scheduling, increase queueing, and become part of the bottleneck. The supplied Windows Resource Monitor capture shows
perfmon.exeusing CPU. That is monitoring-process activity; the screenshot does not establish whether a log collector was active or measure its effect on the workflow.
Treat monitoring overhead as a measured variable. Run the fixed workload once without the collector and once with the proposed collector when the environment allows it. If the accepted-result time or resource pattern changes materially, reduce the counter set, widen the interval, shorten the capture, or collect from a separate management path where supported. A separate output disk can reduce interference with the workload disk, but it does not remove CPU and counter-enumeration cost. Use the exact same collector configuration for baseline and after-change runs, record that configuration with the result, and do not compare an unmonitored baseline with a monitored changed run as if instrumentation were neutral.
If the symptom comes and goes, record it with Performance Monitor. These English counter paths require a Windows edition that includes logman; localized Windows installations may use localized counter names. Open an elevated Command Prompt, choose a unique collector name for the run, and create a bounded circular collector with an explicit output path:
set "COLLECTOR=AIWorkflow-20261018-153000"
set "OUT=C:\PerfLogs\AIWorkflow-20261018-153000"
logman query "%COLLECTOR%" >nul 2>&1 && logman delete "%COLLECTOR%"
logman create counter "%COLLECTOR%" -f bincirc -max 512 -si 00:00:01 -o "%OUT%" -c "\Memory\*" "\Paging File(*)\*" "\PhysicalDisk(*)\*" "\Processor Information(*)\*" "\Process(*)\*" "\Network Interface(*)\*"
logman start "%COLLECTOR%"
Run the fixed workflow, then stop the collector:
logman stop "%COLLECTOR%"
logman query "%COLLECTOR%"
dir /b "%OUT%*.blg"
logman delete "%COLLECTOR%"
Replace the timestamp in both variables for each run. Confirm that the .blg file exists. Open perfmon, select Performance Monitor, open its Properties, select Source, choose Log files, and add that exact .blg file. Microsoft's logman create counter reference documents the collector syntax, and its Performance Monitor troubleshooting guide uses the same pattern to collect processor, memory, disk, network, paging, and process counters over time. The example is intentionally broad and can impose substantial overhead on a process-heavy machine; use it for a short bounded capture, then narrow the counters for longer logging. Keep the counter list, collection interval, file-size limit, and measured observer effect in your record. A long capture at high frequency can summarize samples in the graph, which Microsoft explains in its Windows performance scenario guide.
When memory is the suspect, do not treat working set, commit, standby, and hard faults as synonyms. Microsoft defines a process working set as pages currently resident in physical memory. A hard page fault requires reading the page from a backing store such as the page file or a mapped file. See Working Set. A large working set can be healthy. Repeated storage-backed faults that line up with the delayed step are more useful evidence.
Check antivirus, EDR, backup, and indexing work
Security and management tools are part of the workload. The Windows captures show MsMpEng.exe with non-zero average CPU and Antimalware Service Executable using CPU in another sample. That does not confirm a scan during the delayed task, make Microsoft Defender Antivirus the cause, or make disabling protection a performance plan. It means scanning belongs in the investigation.
File-heavy development and AI work can create or touch thousands of source, package, cache, index, build, container, and generated files. Antivirus, endpoint detection and response (EDR), backup, synchronization, and search-indexing tools may inspect that activity. Their CPU use can matter, but their storage-filter work may matter even when their CPU percentage looks modest.
Microsoft documents Defender Performance Analyzer for Windows 10 and later with Defender platform version 4.18.2108.X or later. Confirm the platform version and use an elevated PowerShell window. Choose a writable output path, then collect a recording during the fixed workload:
$Trace = Join-Path $env:TEMP "Defender-scans-20261018-153000.etl"
New-MpPerformanceRecording -RecordTo $Trace
Start the workload after the command begins recording. When the workload finishes, return to PowerShell and press Enter to stop the recording. Confirm that the ETL exists, then report the highest-impact files, extensions, processes, and scans:
Test-Path $Trace
Get-MpPerformanceReport -Path $Trace `
  -TopFiles 10 -TopExtensions 10 -TopProcesses 10 -TopScans 10
Microsoft documents both commands in the Defender Antivirus Performance Analyzer reference. The report identifies scan activity. It does not automatically tell you what to exclude.
WARNING: Every antivirus exclusion creates a protection gap. Microsoft says exclusions can prevent antivirus blocking, remediation, and inspection. Process exclusions can also stop network protection and attack-surface-reduction rules from inspecting activity for that process. Microsoft explicitly advises avoiding exclusion of the process itself because Defender can then ignore other operations by that process. Review the Defender exclusions overview before making a change.
Use this order:
- Prove that scanning lines up with the delayed step.
- For file-heavy Windows development, evaluate a trusted Dev Drive with Defender performance mode, or the security product's supported equivalent, before considering an exclusion.
- Change the workflow, schedule, storage layout, or generated-artifact location before removing inspection.
- If an exclusion is still justified, limit it to reproducible generated artifacts or caches that are not source, scripts, executables, downloads, credentials, or user-profile content.
- Keep real-time protection, behavior monitoring, script inspection, EDR, and attack-surface-reduction controls active.
- Rerun the accepted-work test and an adversarial validation appropriate to the rule.
- Record the exclusion owner, reason, scope, evidence, expiration/review date, and rollback trigger.
On eligible Windows 11 systems, a trusted Dev Drive is the preferred first design to test for repositories, package caches, build output, and intermediate files. It uses ReFS optimizations and Defender performance mode scans file-open activity asynchronously rather than suppressing scans. Real-time protection must remain enabled, the antivirus filter must remain attached, and enterprise policy still applies. Verify the state in Windows Security > Virus & threat protection settings > Manage settings > Dev Drive protection > See volumes. Do not enable a no-antivirus-filter configuration. Dev Drive performance mode targets file-open delay; Microsoft says it is not the remedy for generally high MsMpEng.exe CPU or memory, which still requires Performance Analyzer and workload diagnosis. See Set up a Dev Drive and Protect Dev Drive using performance mode.
For another endpoint product or operating system, look for a vendor-supported developer volume, deferred or asynchronous scan mode, build-cache integration, or centrally governed equivalent. Verify what remains inspected; a marketing label such as "performance mode" is not proof that the protection model matches Defender's Dev Drive design.
Should you test a RAM drive?
A RAM drive can be a useful experiment when the trace proves that repeated temporary-file I/O is delaying the accepted result and the machine has measured memory headroom. It is not the next automatic step after seeing disk activity. Modern operating systems already use available memory for file caching, and a fast NVMe drive or Dev Drive may make the added complexity produce little useful gain. Measure it.
Prefer a RAM drive for bounded, disposable, reconstructible data such as a specific build scratch directory or generated test fixture. Do not put the only copy of source, credentials, audit records, downloaded executables, model weights, or required artifacts there. Its contents may disappear at shutdown, restart, unmount, crash, or power loss.
If you use a RAM drive for non-scratch data, durable storage must retain a verified last-known-good generation and the synchronization lifecycle becomes part of the system:
- Preserve a versioned, verified last-known-good durable generation. A direct mirror that overwrites the only recovery copy is not sufficient.
- On startup, copy that durable generation into the RAM drive and verify the transfer before the application opens it.
- During operation, track changes and commit them continuously or at a defined interval. Every interval creates a potential data-loss window. Write each commit to staging, verify a manifest, file count, sizes, hashes, or the application's transactional integrity check, then promote the completed generation atomically where the storage and application support it. Retain the prior known-good generation until the new one is proven recoverable.
- Define conflict, rename, and deletion behavior. A deletion should not silently destroy the only durable copy; use versioning, snapshots, or explicit tombstones appropriate to the application.
- Before a planned shutdown or unmount, stop writers, create and verify the final staged generation, promote it, and only then remove the RAM drive.
- After a restart, crash, or failed synchronization, ignore incomplete staging data, recover the last completed generation, and reconcile it before accepting new writes.
A shutdown script does not run reliably during a crash, forced reset, kernel failure, or power loss. Every RAM-only change since the last successfully verified and promoted generation is then lost. If no durable recovery generation exists, the complete RAM-drive contents can be lost. A crash during a direct in-place synchronization can also leave the durable tree partially updated, which is why staging, verification, crash-consistent promotion, and a retained prior generation matter. Continuous or write-through synchronization narrows the loss window but adds CPU and storage I/O, can reproduce corruption or unwanted changes, and may erase the performance advantage that justified the RAM drive. Simple mirroring is not a backup; keep versioned recovery appropriate to the data.
Capacity is the harder constraint. Reserve a maximum size and leave enough measured headroom for the operating system, editor, agents, containers, local models, context/KV cache, and the normal foreground workload. On a unified-memory system, the RAM drive competes with CPU and accelerator allocations from the same physical pool. On Linux, tmpfs uses virtual memory, can grow only to its configured limit, and may use swap unless configured otherwise; the Linux kernel tmpfs documentation makes that distinction explicit. Do not assume every product labeled "RAM disk" has the same allocation or swap behavior.
Security remains part of the test. Confirm that antivirus, EDR, backup, and audit controls can see the selected volume and that any installed storage driver meets organizational signing, update, and supply-chain requirements. Never use a RAM drive to evade scanning. For Windows, prefer the supported Dev Drive path before adding a RAM-disk driver.
Compare the same accepted workload on the normal NVMe or Dev Drive and the RAM drive. Record startup copy and verification time, synchronization CPU/storage overhead, maximum unsynchronized-change window, staging and promotion behavior, retained last-known-good state, final flush and verification time, storage latency and throughput, elapsed time to accepted result, memory pressure, swap/pagefile activity, model residency, foreground responsiveness, cleanup, and recovery after an interrupted commit.
Test recovery only with disposable data in an isolated disposable VM or dedicated test host after confirming an independent recovery copy. Simulate the relevant failure by terminating the writer or synchronizer, or by destroying only the RAM-backed volume. Do not pull power or force-reset a shared physical host; that can corrupt unrelated durable filesystems. Record exactly which failure was simulated. A killed synchronizer tests interrupted-commit handling, while destroying the RAM volume tests loss of unsynchronized RAM state; neither proves behavior during a real controller, storage-device, kernel, or whole-host power failure. Keep the RAM drive only when the complete workflow improves without creating memory pressure, unacceptable loss exposure, ambiguous synchronization state, or weaker controls.
If that improvement repeats, record the RAM drive's required maximum capacity as part of the workload specification. It now belongs in the next-machine decision alongside local-model memory, peak context/KV cache, concurrency, applications, and operating-system headroom. Size each capacity domain separately: system RAM, discrete accelerator VRAM, or a shared unified-memory pool. Count each allocation once in the domain where the runtime actually holds it. If a measured whole-system or unified-memory peak already includes the populated RAM drive, do not add the reservation again; add it only when building a budget from component measurements taken without it. Apply the same rule to model/runtime and KV-cache allocations. Then add explicit growth and non-upgradeability headroom. The result may justify a higher-memory system even when the model alone would fit in a smaller configuration.
Only after those options fail should the exclusion type become a design question. It controls two independent axes: which process is trusted and which files are covered. A full executable path improves process identity compared with a bare name. A folder rule limits the file set but applies to every process. Neither is universally smaller without knowing what the trusted process opens.
| Exclusion | What it can skip | Why it matters |
|---|---|---|
| Repository or writing-folder path | Every covered file and subfolder, regardless of which process touches it | This creates a broad blind spot across source, downloads, generated files, and anything later copied into the folder. |
Bare process name such as Code.exe | Any process with the same image name | A different executable with the same name may inherit the exception. |
Full executable path such as C:\Program Files\Microsoft VS Code\Code.exe | Files opened by that exact executable path | This fixes the identity weakness of a bare name, but it can skip scanning harmful files that the trusted editor or agent itself opens or creates. It is not the recommended default. |
| Contextual exclusion combining an exact process and a specific generated path | Only the documented process/path combination | Where supported, this is often the smallest exception for a measured build or cache hot spot. |
Never create process exclusions for general-purpose interpreters and shells such as Python, PowerShell, Bash, cmd.exe, wscript.exe, cscript.exe, sh, or zsh. Microsoft lists PowerShell, bash.exe, cmd.exe, cscript.exe, and wscript.exe among the Windows process exclusions to avoid, and lists Python, Bash, sh, and zsh for macOS and Linux. I apply the same conservative rule to Python on Windows because it can execute arbitrary code. Keep these tools enabled when the workflow needs them, but keep their script, behavior, network, and endpoint inspection intact. Microsoft's research on fileless and living-off-the-land attacks shows how PowerShell can be used in one such attack path.
Treat Code.exe, claude.exe, and codex.exe as execution brokers rather than fixed-function applications. They can read untrusted repositories, load extensions or MCP servers, invoke shells and interpreters, run dependency code, and act on model or prompt input. A future attack does not need to replace a legitimate agent executable if it can induce that trusted executable to open or create a harmful file. A process exclusion applies to files the named process opens; child processes remain separately inspected unless they are separately excluded. A verified full path is more precise than a bare process name, but it is not a sufficient security boundary and is not my default recommendation for editors or AI agents.
If a measured scan delay remains after supported performance controls and workflow changes, prefer a narrowly governed file or contextual rule for the exact reproducible generated path. The excluded output should be disposable and rebuildable from protected source. Do not exclude repositories, source trees, shell or interpreter processes, downloads, temporary directories, credential stores, or entire user profiles.
Third-party antivirus, EDR, backup, and indexing products expose different diagnostics and policy controls. Use the vendor's supported performance trace and central policy path. Do not create a local exception that conflicts with organization policy or disappears from the audit trail.
Step 3: Triage the Mac host
Open Applications > Utilities > Activity Monitor.
Before the run, select View > All Processes, Hierarchically so parent and child work stays visible. Select View > Update Frequency and record the chosen interval; a faster refresh can help with short events but adds monitoring overhead.
For CPU:
- Select CPU.
- Sort by % CPU.
- Record the suspected process and the System, User, and Idle totals at the bottom.
- Compare the process spike with the timestamp of the delayed workflow step.
Activity Monitor can report a process near 100 percent while aggregate CPU is not saturated. The supplied capture shows exactly that. The process is busy. If the task is still waiting, check whether that process has a single-threaded phase, whether its child process is doing the work, or whether the wait has already moved somewhere else.
For memory:
- Select Memory.
- Sort by the Memory column.
- Record Physical Memory, Memory Used, Cached Files, Swap Used, and the memory-pressure color.
- Keep the view open through the named workload step. A later snapshot cannot reconstruct when pressure changed.
Read the values together. Memory Used tells you how much RAM is in use. Compressed shows how much memory macOS compressed to make room. Swap Used tells you how much startup-disk space holds swapped data. Memory Pressure is the combined operating signal.
The 24 GB Mac capture had high compression and a substantial existing swap allocation, but green pressure at the capture. The next test is not "buy more RAM." The next test is to rerun the fixed workload while observing whether pressure changes, disk activity rises, response time stretches, or the active process stops making progress.
Also inspect the Disk and Network tabs during the same named step. Record bytes read/written and sent/received with the timestamp; a CPU or memory screenshot cannot rule out a storage or remote-service wait. For an intermittent process problem, select the process, choose the More (…) button, and select Sample Process to preserve a short stack sample. The same menu exposes System Diagnostics for a broader macOS issue that cannot be reproduced on demand. Apple's guides explain how to view process information and run system diagnostics. Review diagnostics before sharing them because they can contain machine and process details.
🎓 Lesson
- Windows and macOS expose different labels, but the diagnostic question is the same: did memory service, CPU execution, storage, or another boundary delay this step at this time?
Step 4: Follow the wait beyond the machine
The host can be healthy while the workflow is stalled.
Trace each boundary:
| Boundary | What may be waiting | Evidence to collect |
|---|---|---|
| Local runner | Model load, another request, memory fit, cold start | Runtime status, loaded models, queue/error logs, first-token time |
| Hosted model | Provider queue, rate or token limit, service processing | Request ID, timestamps, status, retry headers, usage response |
| Network | DNS, connection, transfer, remote storage | Request timing, bytes, retransmission or error evidence where available |
| Storage | Source reads, indexes, databases, swap/page file | Disk latency/queue, read/write rate, hard faults correlated to the step |
| Orchestrator | Worker slot, admission limit, polling delay, retry/backoff, dependency | Configured worker/agent maximum, actual active and queued peaks, idle-resident count, job state transitions, worker/model assignment, retry count, poll interval |
| Context and tokens | Oversized history, repeated instructions, cache misses | Input/output/cached tokens, context trimming, request count |
| Human review | Wrong output, missing source, repeated correction | Acceptance result, review minutes, reason for rejection |
If a provider does not expose queue time, record it as unknown. Do not subtract a guessed model-processing time from the total and call the remainder network latency.
Tokens belong in this map because a resource can be logical as well as physical. Repeated context consumes provider capacity, time, and money. Token counting does not fix that by itself. The fix comes from sending less unnecessary material, reusing cached work, retrieving the right source, or routing a bounded task to a smaller model that has already passed the acceptance test. The deeper token-cost analysis belongs in its own article.
Step 5: Look for work that appears idle
A worker can show almost no CPU and still hold memory, connections, an editor process, model state, or a large context. Polling adds another cost: the worker wakes, checks status, performs I/O, and goes back to sleep. If that implementation starts another model turn or adds prompt context, the poll also consumes tokens and can interrupt the working context. An internal status message by itself does not always consume model tokens; measure the implementation in use.
Measure idle work instead of arguing about it:
- Record the configured simultaneous-agent or worker maximum, actual active peak, queued peak, and idle-resident count.
- Pick one worker with no assigned productive task.
- Record its model route, resident memory, and child processes.
- Count status checks for ten minutes.
- Record CPU, disk, and network activity per wake where the platform exposes it.
- Check whether a wake creates a model request, token usage, or a new log/message payload.
- Disable the worker, replace polling with an event, or increase the interval with bounded backoff.
- Repeat the same ten-minute observation.
Use a callback, webhook, blocking queue read, event notification, or bounded long poll when the platform supports it. If polling is unavoidable, batch checks, back off when nothing changes, and retire workers whose retained state no longer has value.
This is also where indexes can pay for themselves. A current source index can reduce repeated discovery. A decision index can keep the same trade-off from being debated in every session. A tested model-and-task index can support routing a bounded research task to a less expensive model without guessing. A routing index can keep simple collection work away from a model intended for harder judgment. An index that is stale or wrong creates its own failure, so every saved decision needs a scope and a retest trigger.
Step 6: Check what Ollama is holding
Local models make retained state visible.
Run:
ollama --version
ollama ps
Ollama reports the models currently loaded into memory, their sizes, CPU/GPU placement, and when they are due to unload. Its current documentation says models remain loaded for five minutes by default. Stop a model immediately with:
ollama stop MODEL_NAMEThe API's keep_alive setting can retain a model for a chosen duration, keep it loaded indefinitely with a negative value, or unload it after the response with 0. Ollama also documents that concurrent model loads require available RAM or VRAM. Requests queue when a new model cannot fit, and parallel requests increase context-related memory allocation. The current details are in the Ollama FAQ.
Do not unload every model by default. You may save memory and add a model-load delay to the next request. OLLAMA_KEEP_ALIVE can set the server default, while the API's per-request keep_alive value can override it for a specific workload. Test the trade:
- Record loaded state with
ollama ps. - Run the fixed request and record time to first token and acceptance.
- Unload the model and confirm with
ollama psthat it is no longer listed. - Run the predeclared number of unloaded-model repetitions with
keep_alive: 0; this does not clear operating-system or file caches. - Send one uncounted setup request that retains the model, confirm it appears in
ollama ps, then run the resident-model repetitions. - Stop the model again, confirm it is absent, and compare the median, range, and acceptance rate. Decide whether reclaimed memory or faster repeat response matters more for this machine.
I ran that bounded test on October 18, 2026 on an AC-powered 24 GB Apple M4 Mac mini running macOS 26.6.2, with Ollama 0.40.4 and qwen2.5-coder:14b. This was a normal active desktop, not an isolated benchmark host; Python, Codex, WindowServer, and other processes were present. The fixed prompt requested a two-field JSON object, a JSON schema enforced the expected shape, and the acceptance test required the parsed result to equal {"status":"ok","items":3}. Three runs unloaded the model after each response with keep_alive: 0; after one uncounted setup request, three measured resident-model runs retained it with keep_alive: "10m".
All six measured responses passed. Unloaded-model wall time had a median of 4.202 seconds and a range of 4.197–8.976 seconds. Resident-model wall time had a median of 2.138 seconds and a range of 2.074–2.138 seconds. The first unloaded-model run spent 6.350 seconds loading the model; later unloaded-model runs benefited from caches this test did not clear. Measured resident-model runs reported 0.001–0.002 seconds of load time. The exact request, environment, per-run timings, limitation, and cleanup result are preserved in OLLAMA-COLD-WARM-2026-10-18.json, and the complete runnable procedure is in ollama_unloaded_vs_resident.py.
This test established the residency trade-off for one short request on this machine. It did not establish the constraint in the supplied Windows or macOS screenshots, measure the retained model's memory cost, or predict another model or workload. That is the boundary a reusable decision record needs.
If a local model is meant to remain available all day, a dedicated runner is usually easier to operate than a primary workstation. That placement decision belongs in the broader execution map: where the assistant, tools, models, and data actually run, and which machine or service owns each resource cost.
Step 7: Change one thing
Write the hypothesis before the change. This prevents the explanation from changing after you see the result.
| Suspected constraint | Supporting observation | Next check | Reversible change | Expected result | Rollback trigger |
|---|---|---|---|---|---|
| CPU contention | Aggregate CPU is saturated during the delayed local build | Identify the process and task phase | Pause competing builds or reduce local worker concurrency | Build phase shortens without changing answer quality | Throughput drops more than latency improves |
| Excess agent concurrency | Active and queued-agent evidence shows local tools or shared services contending during the delayed step | Compare configured maximum with actual active, queued, and accepted-result throughput | Lower the admission limit or route a task class to another node | Accepted-result throughput or foreground responsiveness improves with fewer retries | Required throughput falls or queue age exceeds its target |
| Memory service | Pressure/fault/storage activity rises with the stalled step | Correlate pressure and disk activity | Stop an unused VM or unload an inactive model | Pressure or fault activity falls and step time improves | Cold-load delay or required service outage costs more |
| Local model queue | Request waits while another model is loaded | ollama ps and runtime logs | Limit concurrent models or move one workload | Queue time falls | Required parallel work misses its target |
| Polling overhead | Many status checks produce no useful change | Count wakes and work per wake | Event notification or longer backoff | Fewer wakes/messages/tokens with equal completion detection | Completion is detected too late |
| Temporary-file storage bottleneck with memory headroom | Storage trace aligns repeated scratch-file I/O with the delayed step, while memory pressure and swap remain healthy | Compare the same accepted workload on NVMe/Dev Drive and a size-capped RAM drive | Move only disposable, reconstructible scratch output to the RAM drive | Accepted-result time improves after setup/copy cost, with healthy memory pressure and unchanged protection | Memory pressure, swap, model eviction, recovery risk, or security blind spots increase |
| Security scan overhead | Scanner trace identifies files/processes that align with the delayed build step | Use the vendor performance analyzer and review policy | Supported performance mode, schedule change, or the narrowest approved contextual/path exclusion | Accepted-result time improves while required protection remains active | Protection scope is broader than intended or the measured gain disappears |
| Oversized context | Input and cached-token evidence show repeated history | Compare bounded request with same acceptance test | Retrieve only relevant sources or reuse a valid indexed decision | Lower usage and latency with equal accepted output | Required evidence disappears or correction time rises |
| Wrong model route | Fast result repeatedly fails acceptance | Compare one proven higher-capability route | Route this task class to the capable model | Accepted-result time falls even if call time rises | Cost rises without a pass-rate gain |
| Mismatched reasoning effort | Easy work uses high effort, or difficult work at low effort repeatedly needs correction | Hold the prompt/model constant and compare supported effort settings against the same acceptance test | Route the task class to the lowest effort that consistently passes | Accepted-result time and cost improve without lower pass rate | Correction, retries, or missed evidence increase |
| Runtime configuration mismatch | Model fit, queue, or latency changes with context, quantization, parallelism, batching, or device placement | Export the current runtime settings and compare one supported change | Change one runtime control | The named wait improves and the accepted result remains equivalent | Memory pressure, queueing, quality loss, instability, or fallback increases |
Change one variable unless the old state is unsafe. If you change concurrency, context, model, and machine together, you will not know what fixed the workflow.
Step 8: Prove the result
Before running, declare the repetition count and acceptance test. For a first bounded comparison, three baseline and three changed runs can expose obvious instability; important purchasing or production decisions deserve more repetitions. Keep unloaded-model and resident-model runs separate. Report the median, range, and accepted results rather than selecting the best run.
Compare:
- Queue time
- Time to first useful output
- Total execution time
- Accepted-result time
- Failures and retries
- CPU, memory, storage, network, and runtime state during the named step
- Input, output, and cached tokens where available
- Provider cost where available
- Human correction time
Document environmental differences. A warmed cache, quieter network, changed provider load, background update, or smaller input can explain an improvement.
If utilization falls but accepted-result time does not improve, this test did not establish that resource as the binding constraint. If the task becomes faster and the answer becomes worse, the change failed. If one wait disappears and another grows, the next constraint may have become visible; claim that the intervention moved load only when the measurements show that transfer.
🎉 Tip: A failed hypothesis is useful when the test was controlled. You avoided one unsupported purchase rationale and narrowed the next check.
Step 9: Save the decision so the next person does not pay again
Record five things:
- Workload: the task and conditions tested.
- Evidence: timestamps, counters, logs, request IDs, and acceptance result.
- Decision: the change adopted or rejected.
- Boundary: where this result applies and what remains unknown.
- Retest trigger: the model, runtime, hardware, workload, or scale change that invalidates it.
Put the record in the index used for decisions and routing. Link the source evidence. A title such as "CPU was the bottleneck" is too broad. The bounded Ollama test in this guide supports a precise record: "For the October 18, 2026 two-field JSON test on Ollama 0.40.4 with qwen2.5-coder:14b, three retained-model runs had a 2.138-second median wall time and three unload-after-response runs had a 4.202-second median; all six passed." It also needs the limitation that this test did not measure the memory cost or establish a different workload's constraint.
That record can route future work without repeating the full investigation. The method for making decisions findable and citable is described in The Five-Field Form That Made 32 Decisions Citable.
What is the bottom line?
Do not buy hardware because one graph looks full. Name the accepted result. Mark the step where it waits. Correlate that wait with host, runtime, service, token, and review evidence. Change one thing. Run the same test again.
Start with one recurring AI workflow this week. Give the worksheet below to an approved AI assistant and let it interview you, build the evidence ledger, fill the baseline, and identify the next smallest observation. Once you approve an immutable baseline revision, let it register every verification run, derive the summary, and maintain the decision record. If the result improves without moving the cost into retries, weaker output, another resource, or more correction time, you have a fix you can defend.
AI workflow constraint worksheet
This compact table is useful for reading the article. Use the linked full AI-maintained worksheet for the investigation because it includes the evidence ledger, recorder contract, immutable baseline-revision registry, per-run registry, and AI checkpoint.
| Field | Baseline | After change |
|---|---|---|
| Workload and acceptance test | ||
| CPU/accelerator, assigned logical processors, memory domain, storage | ||
| Operating system/build and power mode | ||
| Application, orchestrator, runner, tools/extensions, and versions | ||
| Provider and exact model/version, or local model/quantization/device placement | ||
| Reasoning effort, context, maximum output, sampling, batching, and parallelism | ||
| Instruction/template and retrieval/index revision; cache and cold/warm state | ||
| Configured agent/worker maximum; peak active, queued, and idle-resident | ||
| Model/task routing and admission/backpressure policy | ||
| VM/container CPU and memory limits | ||
| Other work: builds, models, scanners, sync, backup, indexing, and user activity | ||
| Timeouts, retries/backoff, and polling configuration | ||
| Monitoring configuration and measured collector overhead | ||
| RAM-drive last-known-good generation, staged promotion, sync window/overhead, final flush, and bounded recovery test | ||
| Submit/start/first-output/finish times | ||
| Accepted-result time | ||
| CPU observation during delayed step | ||
| Memory/pressure/fault observation | ||
| Disk/network observation | ||
| Queue/runtime/provider evidence | ||
| Tokens/requests/retries/cost | ||
| Human correction time | ||
| Hypothesis | ||
| One change | ||
| Result and alternative explanation | ||
| Decision, boundary, and retest trigger |
Artifacts
- AI workflow constraint worksheet — baseline and after-change record.
- AI workflow performance discovery prompts — reusable prompts for baseline design, evidence interpretation, agent-concurrency review, model/effort testing, controlled experiments, and decision capture.
- Ollama unloaded-model versus resident-model results — exact environment, request, timings, results, and limits.
- Runnable Ollama comparison — preflight, unloaded-model runs, resident-model runs, cleanup, and verification.
- Mac transient CPU observation — 0 percent idle sample, later return to headroom, and evidence limits.
Frequently Asked Questions
Does more RAM make an AI coding assistant faster?
No, not by itself. More RAM can make an AI coding assistant faster when memory service, model fit, or repeated loading delays the measured step. Check memory pressure, storage-backed faults, model state, and accepted-result time during the same repeatable workload before you buy. If the wait is in a provider queue, a single-threaded phase, retrieval, or correction, test that boundary instead. Read more: Running AI Well Means Managing Everything Around It.
Why does my AI coding assistant lag when CPU is not full?
An AI coding assistant can lag with available aggregate CPU because one execution lane or a different boundary is limiting progress. Storage, network, a local or hosted model queue, rate limits, polling intervals, and human correction can all create the wait. Timestamp submission, execution, first useful output, completion, and acceptance, then correlate the longest gap with the relevant host or service evidence. Save the verified boundary so routing can reuse it without repeating the investigation. Read more: The Five-Field Form That Made 32 Decisions Citable.
Should I exclude my repository from antivirus scanning?
No. A repository exclusion skips every covered file for every process. Do not replace it with a process exclusion for Python, PowerShell, Bash, Code, Codex, Claude, or another tool that can execute or broker arbitrary work. Record scanner impact first. On eligible Windows 11 systems, test a trusted Dev Drive with Defender performance mode while keeping real-time protection and the antivirus filter enabled. Otherwise use the vendor's supported equivalent. Only when measured evidence still requires an exception should it be scoped to an exact disposable generated path with an owner, expiration, adversarial validation, and rollback trigger. Read more: Microsoft's Defender Performance Analyzer reference.
Need help proving what is actually constraining your AI workflow?
If your host, local runner, cloud provider, and agents all look busy at once, we can help you build the measurement, isolate the wait, and verify the change against the work that must pass. Request an AI workflow assessment.
What resource surprised you when you measured the complete workflow? Share the workload, the evidence, and the change in the comments so other readers can compare methods instead of dashboard guesses. Comment LOCAL if you want the local-model placement and memory deep dive next; one person counts as one topic vote. Comment THANKS only to support this article—it does not count as a topic vote. If another AI performance question deserves a full walkthrough, add it in the comments or contact me.
For the next field report in this series, join the free newsletter.
Share this line with the person choosing the next machine: A full graph is a lead; the bottleneck is the resource that delays the accepted result.
Evidence and provenance: The Windows and macOS screenshots were supplied by Dan Stolts and retained as local evidence with observation records and hashes. A later live Mac CPU sample was observed through Activity Monitor and preserved as a structured record because no local publication image was retained. The screenshots show different systems and moments; they are not a benchmark. The Ollama unloaded-model versus resident-model example was measured on October 18, 2026 with the exact prompt, schema, versions, timings, and limitations stored beside the draft. Product behavior and procedures link to current Microsoft, Apple, and Ollama documentation in the relevant sections.